 REWT
Rivers of England and Wales, Temporally
The scale of the work
How much of this can be done in house, and where volunteer or collaborator effort becomes unavoidable. The counts below are measured, not estimated; the hours are illustrative and meant only to separate bounded work from open-ended work.
The distinction matters because it decides the release plan. Work that can be counted can be scheduled and finished. Work that cannot must be released incrementally, or it will hold up everything behind it.
What is bounded
Repairing the modern network
| links in OS Open Rivers (GB) | 192,865 |
| mapped length | ~152,000 km |
| separate connected components | 5,617 |
| nodes where water arrives and cannot leave | 2,516 |
| isolated canal systems needing attachment | 289 |
| links where terrain contradicts the stated flow direction | 757 |
2,516 sounds like a research programme and is not, because the defects cluster: one misdrawn junction strands everything above it. The scoping exercise cleared the bulk of them with 73 hand-authored corrections — roughly one judgement per thirty defects — each checked at the place by one person in a few minutes.
This build has not repeated that ratio, and the difference is in what counts as a judgement. It carries 1,205 corrections and still has 1,303 dead ends outstanding; of those corrections, 1,203 record judged by rule, not by a person looking at the place, and two were adjudicated at the place. A rule that proposes a connector where one river resumes under its own name 56 m away is worth having and is not the thing the 73 were. The bounded quantity on this page is the number of places a person must still look at, and this build has not yet measured it.
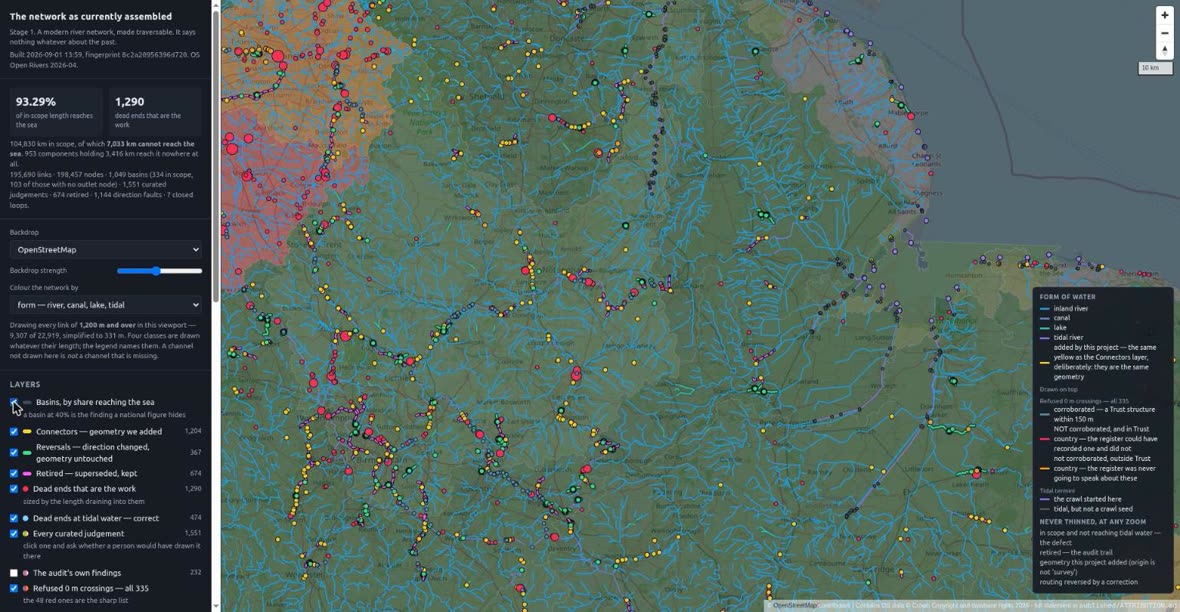
8c2a2095, over OS Open Rivers 2026-04, when 93.29% of in-scope length reached
tidal water and 1,290 dead ends were outstanding. Tidal water, not the sea:
those are two different tests and this figure is the first of them. Neither can be read off
the other, and the sea reading is not simply the harder version of this one. Contains OS data © Crown copyright and database
rights 2026. Base map © OpenStreetMap contributors.That clustering has now been looked at rather than taken on trust. Drawn over the current build, the dead ends are nothing like evenly spread: they pile into the canal country of Cheshire and the west Midlands, and into the Fens, while Wales, the south-west peninsula and the northern uplands are comparatively clean. And the largest single one shows why a count is the wrong unit — 456.7 km of the Manchester Ship Canal drains to one node with no outflow, at 378231 E, 398190 N. That is one defect, one judgement, and one repair. The grid reference is quoted because the audit gives one for every finding, and a finding without a place cannot be checked — which is how this figure was caught being stale here while the audit had moved on.
Verdict: in house. Days of adjudication, not months, and the crawl-from-the-sea method generates the queue automatically and ranks it by how much water is at stake.
These six figures are measurements of OS Open Rivers as shipped, carried over from the scoping exercise. They are legitimate to check a rebuild against and are not results of this repository; the issue they were taken from is not the issue now being built from. The current build’s own figures move as it is worked on, and will be quoted here when the first edition is fixed rather than while it is in flight.
Old courses the Victorian surveyors labelled
Volunteers have already transcribed 2.6 million labels (GB1900) from the six-inch County Series second edition. Within them, in England and Wales:
| label | labels | distinct places | what it is |
|---|---|---|---|
| Old Course | 139 | 126 | the surveyor stating which of two channels is superseded |
| New Cut | 224 | 209 | the same statement from the other side |
| Towing path | 2,169 | 1,724 | direct evidence that this channel carried traffic — see navigation |
| Mill channels — Mill Race, Mill Leat, Mill Pond | 4,996 | 4,068 | frequently medieval, and belonging in the reconstruction |
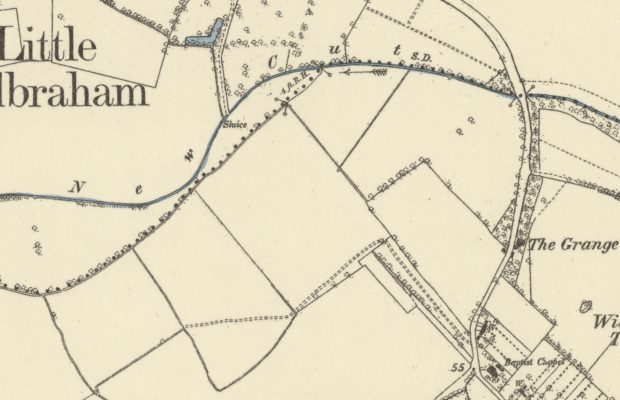
Two columns, because a caption is not a channel. The Ordnance Survey repeated a name along the feature it named, so one stretch of abandoned river can carry Old Course three or four times and a transcription of the labels counts the type, not the river. The second column collapses labels reading the same thing into one place where they are within a kilometre of each other.
The correction turns out to be small, and that is worth stating because the opposite was expected. Repeated captions are set far apart: no two Old Course labels in England and Wales are within 300 m of each other, and the median distance from one to the nearest other label reading the same thing is 1.7 km. Collapsing at a kilometre takes 139 labels to 126 places — nine per cent, not a factor. What the labels count and what the work counts are nearly the same number.
361 labels at some 274 distinct places for Old Course and New Cut together, taking the two classes as one and clustering on position alone — the two captions describe the same event from either side, and often sit on the same reach. 361 and not 363, which is what the two rows above add up to: each row is a pattern rather than a literal caption, two labels answer to both patterns, and a union counts those once. Each is a statement by someone who was there, not an inference from the modern line. At ten minutes to find the sheet and trace the channel, that is about six working days.
Not all of them are channels, and the queue needs a cleaning pass. Read through, nine of the 274 name no watercourse at all: they are the New River Company’s built estate — NEW RIVER STREET, NEW RIVER WALK, New River Head, a gate house, a pumping station, a well, and three reservoirs. The pattern is matching a proper noun, because a company named after a river carries the river’s name across everything it owns. A caption naming a thing is not a caption describing one, and a transcription records what the surveyor wrote rather than what the feature is.
A further ten or so letter only a structure standing on the channel — New Cut Bridge, Old River Farm, Old Eau Field. Those are not contamination. A bridge named for a cut locates a cut the surveyor did not letter, which is weaker evidence than a lettered channel and is a good deal better than nothing; they belong in the queue with that written on them. The line between the two groups is a judgement in a handful of cases, which is itself the reason the pass has to be made by a person.
Verdict: in house, comfortably. This is the second edition’s core, and it is finishable.
How these were counted. From the CC0 raw dump of the GB1900 transcriptions, never from the published gazetteers, which are CC-BY-SA: share-alike would propagate into this project’s own exports, and the abridgement drops every string occurring 300 or more times nationally, which is exactly the mill and towing-path vocabulary. A pin’s text is the reading most volunteers gave it. Extent is England and Wales by OS Boundary-Line country polygon, which matters more than it sounds: 1,888 of the 6,884 mill-channel labels in Great Britain fall in Scotland — lade and lead are Scots, and they are two of the four commonest terms.
That country split is a proxy for the scope rule and not the rule itself. Scope is decided on basins: a basin with any part in England or Wales is in scope entire, Scottish headwaters included, and only ground draining solely to Scotland is out. So these counts are a slight undercount, by whatever labels sit in the Scottish parts of the Tweed and Border Esk. The direction is known and the magnitude is not, because the labels have not been counted against the basins — which are now delineated, 1,049 of them, 334 in scope. Earlier drafts of this page gave 161, 219, 2,214 and 10,738 for the four classes. Two of those reproduce exactly; the mill-channel figure does not reproduce at all from the source, at any extent, and has been replaced by the measured one.
Valleys drowned by reservoirs
A drowned channel has not ceased to exist; it is under water, and its course is recoverable from a map made before the dam. Much of Victorian water supply predates the second series, so a good share of these need the first series — county by county rather than a single national mosaic, and so slower.
How many there are is still not a figure this project can quote. The scoping exercise reported 606 reservoirs marking 1,834 links, and did it by joining a gazetteer to the network. The network alone cannot do it, and the reason is a naming convention rather than an absence. Of 24,146 standing-water links, 18,104 carry no name at all; of the 6,042 that do, 68% carry a running-water name — Burn, Brook, River, Beck — and under 5% a standing-water one. Not one contains the word “Reservoir”. A lake link is named for the watercourse routed through the water body, not for the water body, so the absence of the word is evidence about how OS names things and not about what the network holds. The best national inventory reaches about a quarter of the inherited figure — 493 of the 24,146 standing-water links lie within 500 m of one of its entries — so the count stays inherited rather than earned.
The reservoirs are there. They are under the names of the valleys they drowned. Kielder Water is twelve lake links carrying Belling Burn, Cranecleugh Burn, Hawkhirst Burn, Little Whickhope Burn and Mounces Burn; Ladybower carries River Ashop and Ladybower Brook; Rutland Water is eight links and every one of them unnamed. That is a better fact than the one it replaces, and it points somewhere: where a lake link still carries a watercourse name, the name of the drowned channel has survived the flooding of it. Three reservoirs checked is not a sample, and whether it holds nationally is worth establishing before anything leans on it.
The list that would close that gap exists and is not published. Every reservoir holding more than 25,000 m³ above the surrounding land is on a statutory register kept by the Environment Agency — which is exactly the tail a storage-weighted inventory omits, and which is compiled on a raised water test far closer to “drowned a valley” than a volume threshold is. It is not open data. The guidance says that to see it “you’ll need to write, email or call the Environment Agency and ask for a copy of the register”. A copy released under freedom of information in 2020 is republished by a third party with fields withheld for data protection, and a five-year-old extract of a live statutory register is not something this project will build on. The gap is not that no such list exists; it is that this one is not published, and that is a thing a reader can act on where an unexplained absence is not.
The dates can be looked up, for the large ones. The CEH inventory of UK reservoirs holds 273 reservoirs, 233 of them in England and Wales, and 252 carry a completion year — 92%, each with its own quality flag and a reference. Its threshold is stated rather than accidental: reservoirs over 1,600 Ml, plus smaller ones inside a group with historic storage information, which puts the median entry near 4 million m³. The big ones are dated and the tail is not, and the tail is where the small Victorian impoundments are.
Wikidata is not the place to look, and was tested so that nobody tries it again: of 1,125 items typed as reservoirs in the United Kingdom, 24 carry a construction date, and not one of Kielder Water, Rutland Water, Ladybower, Haweswater, Lake Vyrnwy or Derwent does. The dam records are no better — 101 items, 5 dated.
The value of the date is that it picks the edition before anyone opens a sheet. Set each completion year against the County Series survey dates for the county the reservoir sits in, and the 165 impounding reservoirs of England and Wales sort themselves:
| what the tracer will need | reservoirs |
|---|---|
| the second edition shows the valley | 95 |
| second edition, surveyed while the dam was building | 9 |
| the first edition only | 14 |
| first edition, surveyed while the dam was building | 26 |
| earlier than both editions | 19 |
| no completion date | 2 |
Two in five need the first edition or earlier — which is the expensive half of the work, county by county — and 19 predate both editions entirely: the Ouse Washes 1652, Butterley 1794, Rudyard 1796, Chasewater 1797, Hollingworth Lake 1800, Bala 1804. Those need a pre-Ordnance-Survey county map, or they have no map evidence at all. Knowing which before the search starts is the difference between an afternoon and a week.
Fifteen of those are sitting in the network already. Of the 19 impounding reservoirs predating both editions, 16 have a standing-water link within 250 m; one of the 16 is Llyn Tegid, which Telford’s works raised in 1804 rather than created and where the Dee still runs through, so fifteen is the real figure — Butterley 1794, Rudyard 1796, Chasewater 1797, White Holme 1816, Killington 1819, Belmont 1826, Belvide 1833, Brent 1835, Entwistle 1838, Chew Magna 1850, Rhodeswood 1855, Tittesworth 1858, Torside 1864, Cropston 1870, Vale House
- Not one of those fifteen links carries a name of any kind, which is the same finding as the unnamed reservoirs seen from the other side. It is the problem in its sharpest form: the network holds the water, no Ordnance Survey edition holds the valley, and nothing in the data says the water is a reservoir at all.
Wales is harder, and countable, because Wales publishes its register. Natural Resources Wales issues the Reservoirs Act register as open data: 400 reservoirs, 316 of them impounding, 365 with a year built. Its statutory threshold — 10,000 m³ held above the adjoining ground — reaches far below the hydrological inventory’s, and it shows: 366 of the 399 with a capacity are smaller than the inventory’s own cut-off, and only 37 of the 400 appear in it at all. Run the same edition comparison over the 316:
| what the tracer will need | Welsh impounding reservoirs |
|---|---|
| the second edition shows the valley | 142 |
| second edition, surveyed while the dam was building | 9 |
| the first edition only | 27 |
| first edition, surveyed while the dam was building | 18 |
| earlier than both editions | 87 |
| no year built | 33 |
Eighty-seven predate both editions — more than a quarter of the Welsh impoundments that carry a year, against about one in eight in the inventory’s England-and-Wales set. The two counts are over different populations, the register reaching much smaller reservoirs than the inventory does, so it is the proportion that compares and not the totals. And the reason is the survey rather than the reservoirs: the Welsh county first editions were surveyed late, mostly 1873–1888, so a dam of the 1850s has no pre-flood Ordnance Survey sheet at all. For those the recourse is the pre-Ordnance-Survey county maps — the same shelf the mill mapping was compiled from.
Treat those years as declarations, not as dates. A registered year is what the undertaker wrote on a form at registration, with no source recorded, and the rounding shows it: 112 of the 365 end in a zero, against roughly a tenth expected by chance. A fifth to a quarter are approximations. The two oldest — Llyn Frogwy at 1350 and Llyn Llwydiarth at 1500 — are claims on a regulatory return and should be read as claims.
Read the two middle rows as statements about counties, not about sheets — and note what sharpens them. Checked sheet by sheet rather than by county span, the first edition turns out to be the last survey before the dam for every one of the largest reservoirs. There is no contradiction: the big reservoirs are mostly twentieth-century, so a Victorian survey comfortably predates them, and the reservoirs that fall in the difficult rows here are the early ones — the Victorian impoundments built while the county was being surveyed, or before it was surveyed at all. The rule to work by is the sheet’s survey date against the reservoir’s, not the edition number.
The comparison is per historic county and the survey spans are long — Yorkshire 1844–1893, Lancashire 1842–1893, and those two hold 73 of the 273 entries between them. Surveyed while the dam was building means the county was being mapped across those years, not that the particular parish sheet was: it narrows the search to one edition and a decade, and does not settle it.
Verdict: in house, but the largest bounded item. Several hundred hours. A candidate for the first thing volunteers are invited to help with, because each unit of work is self-contained: one reservoir, one pre-dam sheet, one traced valley.
What is not bounded
The mill channels
Some 4,068 places in England and Wales. Still an order of magnitude larger than everything above it, and each requires a judgement rather than a trace: a mill leat may be medieval, Victorian, or a nineteenth-century rebuild on a medieval line, and the map does not say which.
The obvious way to date them was tested, and it does not date them. The pre-Ordnance Survey half of Mills of Britain carries 17,120 records in England and Wales, 10,371 of them water-powered, read off county maps, estate maps and the Roy Military Survey — 60 to 170 years earlier than the six-inch sheets. But its date field is the final survey or publication year of the map the mill was read from. It is a terminus ante quem from cartographic attestation, and there is no documentary, Domesday or archaeological date anywhere in it. A mill attested in 1818 is a mill standing in 1818, which is what the six-inch sheets already say, later and more precisely.
What it does give is a second and earlier attestation of mills, which is worth having and is not the same thing. Some 5,150 places, and 47% of its water-powered sites have nothing within 250 m in the mill layer filtered from the six-inch labels. Earlier evidence that a mill stood is earlier evidence that a leat existed; it moves the terminus without dating the origin.
But as a way of finding the labelled channels it reaches under a third. Of the 4,068 mill-channel places, 1,250 — 30.7% — have a pre-Ordnance-Survey watermill site within 250 m; 45.6% within 500 m, and the median distance from a place to the nearest mill site is 376 m. Widening the mill side to every non-wind mill in the layer moves 250 m only to 34.9%. The mills and the labelled channels are simply not the same population, and the natural misreading — that the earlier mill mapping backdates the leats — is wrong twice over: it carries no date of origin, and it is not looking at most of them.
Handle the positions with care in any case. The data is published in UTM zone 30N, the authors warn that locations may not coincide with the Ordnance Survey, and they carry their own flag for whether a mill falls within 275 m of a river at all.
Verdict: not in house. This needs either volunteer adjudication at scale or a defensible sampling strategy — and the honest answer may be to publish them as a class identified but not dated, which is a real contribution on its own.
The documentary and regional research
The rebuilt landscapes — the Fens, the Humber, the Somerset Levels and the rest — are where the modern channel is worthless and the answer is local. A tenth of England lies inside an Internal Drainage District: 12,779 km, 13.3% of the mapped network. That is the measurable extent.
Each region has its own literature, its own archives, and its own specialists. Nobody can work through all of them, and the material is of a kind — cartularies, drainage awards, deposited plans, county archives — where a person who already knows the region will be faster by an order of magnitude than a person learning it.
Verdict: collaborators, region by region, indefinitely. This is the third edition and after, and it is why the third edition is defined as never complete.
Courses recoverable only from another synthesis
Oksanen’s Inland Navigation in England and Wales before 1348 holds 652 records, with a median continuous part of 3.6 km — and where a course is derived from a parish boundary it sits a median 236 m from the modern channel.
That 236 m is not error. It is the historical signal: the boundary remembers where the river was. But it means the synthesis cannot be merged into a traced network without reconciling two orders of accuracy at every junction, silently. The route to a better course is the material behind it, retraced, not the line resampled — which puts it in the open-ended category with everything else documentary.
A further 19,434 boundary-fossil candidates exist but rest on a licence-encumbered boundary set, and cannot be published from.
Part of this has been done already, and it is the hard part
The counts above describe work as though it were all ahead of us. For one of the hardest regions it is not, and a scale page that does not say so is misleading about its own subject. It would be equally misleading to imply the problem is mostly solved, so both figures are given below.
The pre-drainage courses of the Great Level have been traced and dated. Not sketched, not inferred from the modern line: the medieval channels are carried as separate features on their own courses, at a vertex spacing close to that of the modern national product, traced from eighteenth-century and early Ordnance Survey mapping and from the Fenland literature, with the navigation status of each section cited row by row. The Well Stream — the medieval outfall of the Great Ouse, and the single largest hole in the scoping exercise’s network — is in it, 1.4 km from any modern watercourse. So is Morton’s Leam. That is Max Satchell and Leigh Shaw-Taylor’s waterways GIS, and it represents a body of work comparable in scale to the second edition proposed here.
The same corpus holds 349 years of dated navigability across some 2,801 waterways, a craft-capacity grading per section, and 665 sections flagged as navigable at some point before its window opens. There is nothing else like it, and this project has no route to producing it independently: it rests on the navigation literature read systematically, which is a decade of scholarship rather than a pipeline stage.
None of it is openly published. It sits under a safeguarded deposit licence — a choice made at deposit rather than a constraint on its authors, who can license their own work as they wish. The geometry was traced from Ordnance Survey mapping now out of copyright, so nothing third-party stands in the way of relicensing it.
How much of the tracing it covers — and why it is not most of it
A navigation network stops at the navigable head. That is not a shortcoming; it is what the object is. But above the limit of navigation lies the great majority of the drainage — and with it the great majority of the mill infrastructure. The mill channels the six-inch surveyors labelled are on brooks and becks no boat ever reached.
That is measurable, and it was measured, with a control to prove the measurement:
| GB1900 places | within 250 m of a navigable section | median distance to one |
|---|---|---|
| mill channels (4,068) | 5.5% | 5,612 m |
| towing paths (1,724), as a control | 97.8% | 32 m |
The control is the point. Towing paths land on the navigable network almost perfectly, which is what they must do if the comparison is sound — so the mill-channel figure is a real separation and not a coordinate error or a coverage artefact. 94.5% of the mill-channel places lie more than 250 m from any navigable water, and the median one is five and a half kilometres away. Two orders of magnitude between the medians. The corpora describe different country, and the largest single item on this page’s own list is essentially untouched by the navigable one.
The proportions say the same thing from the other side. 20,247 km of navigable water against some 152,000 km of mapped drainage is 13.3%, and only part of that is a pre-improvement course rather than a channel that still runs where it is drawn. Measured directly — how far each section sits from the nearest modern line — 101 river-type sections, 471 km, 2.3% of the corpus by length, are drawn on a course the modern survey does not carry. Of the sections that diverge most, the majority are abandoned canals: lost artificial cuts, Georgian and Victorian, which is a different thing from a river’s older course.
That 2.3% is a floor and not an estimate, and the reason is worth stating because it cuts in the corpus’s favour. The test can only see a course that diverges from the modern channel — and improvement generally followed the river, so an old course usually sits a few metres from the modern line and is indistinguishable from a modern trace by geometry alone. What proportion is genuinely pre-improvement cannot be settled without reading the per-section citations one by one. The Fens are exceptional precisely because there the two do not coincide: a landscape rebuilt so completely that the medieval channels had to be mapped separately to be mapped at all.
Set against the network this project wants traced, a reasonable estimate is 15–20% — that is Stephen Gadd’s judgement rather than a measurement, and it is consistent with the 13.3% above. It is marked as an estimate because it is one.
So the honest summary is: the hardest fifth is done, and it is done to a standard this project could not reach on its own. The remaining four fifths are tracing — bounded, repetitive, and needing many hands rather than one specialist.
Which is the other half of the argument, and the reason the two fit. The tooling for contribution is the answer to that remainder: a snap-to-ink tracer that fits a segment to the printed ink of a historic sheet, so two people tracing the same channel produce substantially the same line and every vertex records which sheet it came from and whether a hand or an algorithm placed it; and a correction tool that returns a report against a specific line with the identifiers needed to act on it. That is what would make the other four fifths feasible — machinery for distributing the work rather than a promise of effort. Both were built and used in the scoping exercise, and neither is yet rebuilt here; the rebuild is part of the second edition, not a thing a reader can go and use today.
What each side actually has
Set out plainly, because the case for collaboration is an exchange and not a request.
| What the waterways GIS has | dated navigability over 349 years, cited per section; pre-drainage courses in the Fens, traced; vessel capacity as evidence; the navigation literature systematically encoded |
| What it does not have | the headwaters — it is a navigation network, and navigation stops where boats stop; flow direction, and any modelled flow; an open licence; and a way to record a bound as a bound — its window opens at 1600, and a year column cannot distinguish already open by then from no date known |
| What this project has | a directed, traversable drainage network covering the whole catchment; modelled flow and water power potential; a date model that carries bounds instead of forcing years; the river improvement legislation and proclamations — what was authorised, which is not evidence of what was built or used, but is dated and is a place to look; an exporter that refuses to write anything not openly licensed; tooling for contribution and correction |
| What it does not have | any of the first row |
What the method would actually be
Not two maps overlaid. Three steps, each of which needs the other side:
- Splice the navigable courses into the modern network. The modern network supplies precisely what a navigation network does not have: the headwaters, the tributaries, the whole drainage above the limit of navigation. That matters because the flow at a navigable reach is made upstream of it, in country no boat ever went.
- Flood the spliced network with this project’s hydrology. A per-cell water balance routed over the combined network gives every dated section a modelled discharge — and, because an epoch is a rebuild rather than a filter, gives it one per time slice rather than once. A reach navigable in 1700 and disused by 1830 can then be asked what was flowing down it in each of those years, over the network as it then stood.
- Push the slicing back before 1600. His window is censored at its start; the date model is built to carry that honestly rather than paper over it, and the documentary record of drainage and improvement works — including the authorising legislation and proclamations — gives dated bounds to work back with. Not certainty, and not interpolation: bounds, recorded as bounds.
This is not the splicing this project refuses elsewhere, and the distinction matters because the refusal is on the record. What is ruled out is merging a national synthesis — courses derived at a synthesis’s own resolution, sitting a median 236 m from the modern channel — into a traced network, because the reconciliation then happens silently at every junction. That objection does not apply here: this geometry was traced from Ordnance Survey first-edition and Old Series sheets at a vertex spacing close to the modern product’s own, and each section carries its citation. The rule was never “never splice”; it was “never splice two different orders of accuracy”.
Why this project is a vehicle rather than a competitor. Its lines are not merely attributed — every line carries what it rests on, so a citation per section survives into the published product instead of being flattened into a layer. Its licence rule is enforced by the exporter rather than promised in a readme, so terms granted are terms kept. Its date model records what a source actually says rather than forcing a year, which is the only honest way to publish a navigability range that is censored at one end. And it is built to be released in editions, so contributed work appears under its contributor’s name at the next edition rather than waiting on the whole.
And what the two together make possible. Neither dataset alone can weigh water power against water route as determinants of pre-industrial settlement — power needs flow and fall over the whole drainage, route needs dated navigability over the navigable part, and they have never been carried on the same lines. Spliced, they are. That is a question about occupational structure and urbanisation rather than about rivers, and it is not one this project would think to ask on its own.
What is not claimed. This project’s network is a drainage network — 152,000 km against 20,000 km of navigable water — and the two are different objects with different purposes. The waterways GIS is not a subset of it and would not be absorbed into it. The proposition is publication and interoperation, not assimilation.
What this adds up to
| strand | count | who |
|---|---|---|
| network repair | 1,205 corrections applied, 1,303 defects outstanding | in house, days |
| Old Course / New Cut traces | ~274 places | in house, ~6 days |
| reservoir valleys | count not yet earned; 165 impounding reservoirs inventoried | in house or volunteers, months |
| mill channels | ~4,068 places | volunteers, or publish undated |
| regional documentary research | 12,779 km of rebuilt landscape | collaborators, indefinitely |
The first two rows are a publishable dataset. That is the argument for releasing in editions rather than waiting: the bounded work produces something useful and complete on its own terms, and the unbounded work is added to it a course at a time without disturbing what is already there.
Designing for contribution
If volunteers are to help, the tooling has to exist before they are asked. The scoping exercise built the parts of it that were hardest and proved they work; neither is rebuilt in this repository yet, and this section describes what is being rebuilt rather than what is deployed:
- A correction-request tool. A reader selects the stretch that is wrong, says what is wrong with it, and the report carries the identifiers needed to act on it. Feedback against a specific line is worth far more than feedback about a map.
- A snap-to-ink tracer. A traced segment is fitted to the printed ink of a historic sheet rather than clicked freehand, so two people tracing the same channel produce substantially the same line. It records which vertices were placed by hand and which by the algorithm, and on which sheet — so a contributed trace carries its own provenance. That record is not only for the reader: it is what keeps a source-restricted version of the dataset extractable should the project’s reading of what a traced line is ever need revisiting.
GB1900 is the proof that this scale of volunteer work succeeds: 2.6 million labels, transcribed by the public, and the reason the assertions this project most needs are already findable. The same constituency exists for river courses.